The main map and the locator map at this site were constructed with JShape software. Jshape provides a means of viewing a very common type of geographic information system (GIS) file, ESRI's ArcView shape file, on the internet or locally. You can learn more about Jshape at: www.jshape.com. The instructions below are for Jshape as it is implemented on this web site, particularly for the main map. The user should realize that the speed with which Jshape displays varies greatly, depending on the speed of the users's computer, the size of the file being loaded, and the speed of the Internet connection. We have aimed for a middle position in developing this site. Our hope is that it will work quickly enough to be usable on an average system with a fast modem or a broadband Internet connection. We will point out some hints for speeding up response as we discuss the particular maps.
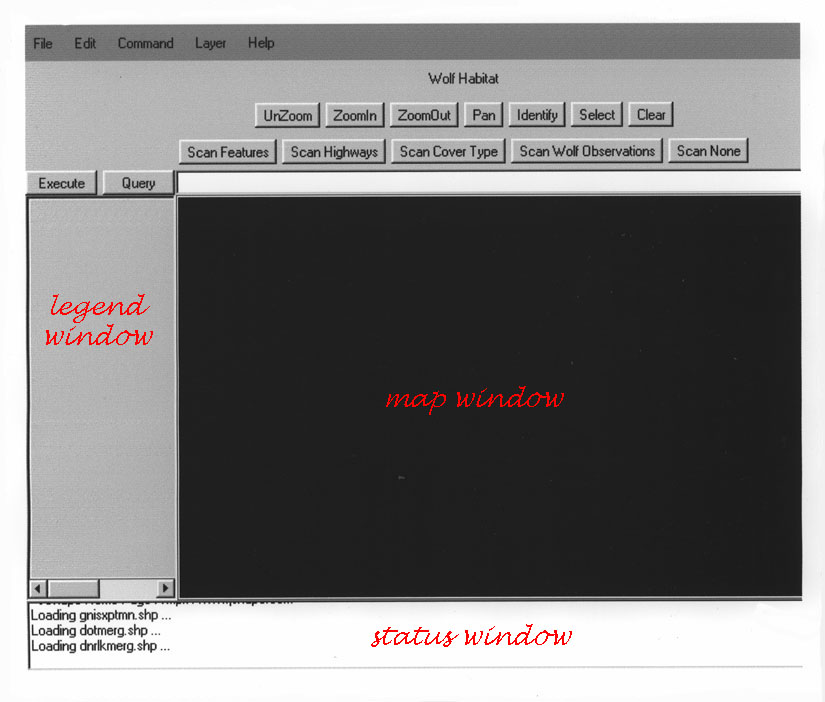
The illustration below shows the main map. This map has a large number of buttons. The large black area is the map window where the map will appear. The size of the map window can be toggled with the button in the upper right hand corner of the map window. The gray rectangle to the left of this box is the legend window where the map legend will appear. The legend of the Cover Type layer of the main map is too long to fit the window. The scan buttons provide an alternative way to identify map components. The white rectangle below the map and legend windows is the status window. This window shows messages about what the program is doing as it loads, and also shows results of clicking some of the buttons.
The Legend Window:
The legend consists of several layers. For our main map. these are: Features, Highways, Lakes, Sections, and Cover Type. The active layer is highlighted white. Certain commands and menu choices affect only the active layer. A layer can be chosen to be the active layer by clicking on it in the legend window. The first four layers are displayed by default in the map window unless the user unchecks the check boxes for these layers in the legend window. The Cover Type layer, however, is not displayed unless the user checks its box in the legend window, and then clicks on the load button. The reason for this is that this layer is very large and can take a long time to load. The map is set up so that only a portion of the Cover Type layer loads at once. The way to use it is to zoom in to the area of interest either with the zoom button or by using the Township, Range, and Section selection boxes in the frame to the left of the map. The smaller map extents take less time to load the layer. If the map extent is too large the load button letters will be white and the button will be inoperative. If often works well to zoom in using the Township, Range and Section selector, zoom out once with the Zoom Out button, and then load the Cover Type Layer. Areas that appear colored have Cover Type loaded. Areas that are black do not have Cover Type loaded. Although the Cover Type layer is the most time consuming layer to use, in many ways it is the most interesting because it shows habitat detail.
The Menu :
|
|
File:
Print map - not implemented here.
Print status - not implemented here.
Edit:
Copy - copies the selected item to the clipboard.
Command:
Label on - turns on a label for each item in the selected layer. Selected layers are highlighted in the legend box. It makes most sense to use this option on a zoomed-in piece of the map rather than the whole thing as the labels can obscure the map.
Label off - turns the labels off.
Layer:
Top layer - selects the first layer in the legend box. A layer, such as the "Highways" layer, for example needs to be selected for some functions such as the "identify" or "select" buttons to find items in that layer.
Bottom layer - selects the last layer in the legend box. Because some legends are too long for the box in this jshape implementation, the bottom layer may not be visible in the legend box. It can still be selected here.
Up layer - selects the layer immediately above the currently selected layer in the legend box.
Down layer - selects the layer immediately below the currently selected layer in the legend box.
Help:
Help - causes a list of user commands to appear in the status box.
About jshape - connects to the jshape homepage, http://www.jshape.com
The Zoom Button line:
 |
Unzoom: Restores the map view to the full extent of the map.
ZoomIn: To use this most effectively, click the "Scan None" button first. The "ZoomIn" button allows the user to draw a zoom box with the mouse, then zooms in to the approximate extent of the box. If the box does not appear when you start to draw, the function is not active yet. Wait till the box appears. A zoomed-in view of the map will allow better view of details. After the zoomed-in map appears, use whichever scan buttons you like. The zoomed-in map will speed up the response time of the "scan" buttons and the other functions. Loading the Cover Type layer is not possible without a zoomed-in map.
ZoomOut: Zooms out a little.
Pan: Recenters the map. A line appears when you draw with the mouse. If you draw from the center of the map to where you want the new center to be, the point where you stop will be the new center. Like the ZoomIn function, if you don't see the line when you hold down the mouse button and start to draw, the function is not active yet.
Identify: Identifies the features of the selected layer in the status box.
Select: Allows thew user to select features of the active layer with the mouse. They will turn yellow on the map.
Clear: Clears the selected features.
The Scan Button line:
|
|
Scan Features: Scans the "Features" layer. Popup labels appeear identifying the lakes, islands, creeks, and other features marked by red dots. The program responds when the mouse hovers over the dot - no click is needed. If response time is slow, consider closing unecessary layers by unchecking them in the legend box, or zoom in. Response is faster with a more limited area of coverage. These response time comments apply to all of the "scan" buttons.
Scan Highways: Scans the "Highways" layer. Popup labels appear identifying the highways. Notice that highways are rather sparse. A portion of the map lies within the Boundary Waters Canoe Area Wilderness, a federally protected roadless area.
Scan Wolf Observations: Scans the "Sections" layer, and reports the number of wolf observations from the section (approximately one square mile) over the course of the study on a popup label. Sometimes this function lags, so using the Lfield=27 command as described below is usually a better alternative. The map area does not include all wolf observations, it was selected to include most of them, but wolves, especially wolves setting out on their own, can travel a long ways. Look also at the Wolf Observation .pdf maps to see the general use pattern for the area. When speculating on what constitutes favorable habitat, keep in mind that the area outside the area where one or more observations per section are common might best be left out of the equation. It may not be unfavorable habitat; it could be the territory of untagged wolf packs.
Scan None: Scan is turned off when this button is selected. No popup labels appear. It speeds up respose of the other functions to have the scan function turned off.
The Command line:
|
|
The Box: A command or query entered here is performed when the Execute or Query buttons are clicked. See the help button instructions above for obtaining a list of user commands. One very useful command is LField= (a number), followed by selecting Labels On from the command menu. This causes labels to appear on the map. It can be an effective alternative to the scan buttons. For example, if the user clicks on "Highways" in the legend window to make it the active layer, types "LField=8" in the box, clicks on "Execute", and then selects "Labels On" from the command menu, each named road will be labeled on the map. Likewise, making "Features" the active layer followed by "LField=5", "Execute", and "Labels On" causes labels for all of the features marked by red dots to appear on the map. For Cover Type, if Cover Type is loaded and active, the LField should be 6. For Sections, using LField=27 results in the number of wolf observations for each section appearing on the map. The user will find that labels are most effective on a zoomed-in map. They can get in the way on a zoomed out map.
Execute: This makes the command entered in the box happen.
Query: Query functions are not discussed here because they require familiarity with the structure of the database underlying the active layer that is not available to users at this time.